home // text // multi-media // misc // info
science red-rover astronomy Red Rover – It's full of stars
As Autumn (my favourite season) set in and September came to a close, I decided to put Spare Parts/whatever-I-call-it-now-that-EA-stole-my-valuable-IP on an indefinite hiatus. When I started development, it was supposed to be a quick and dirty prototype to occupy me for all of one month; instead, I ended up changing engines three times (including trying to roll my own), and still wasn’t anywhere near feature-completeness half a year on (cough). On the other hand, I really like the concept, and I’ll hopefully find the time to get back to it some day1.
In its place, I felt it was time to return to my long overdue and much-hyped(?) pet project: Red Rover. I’m remaining stubbornly quiet about the actual gameplay (hint: there’s none to speak of), but in any case that’s rather irrelevant to the present discussion.
This post is about science!
The more perceptive among you may have a) noticed that I like astronomy; and b) reasoned that, perhaps, Red Rover has something to do with space. Your reasoning is sound, sir or madam! In fact, the game involves a good deal of extremely boring space travel against a backdrop of nothing but the infinite depth of the cosmos. But the funniest thing about the cosmos (an entity that is, on the whole, hilarious) is that it’s full of stars. I spoke to my design team (a Sir Isaac Newton fingerpuppet and a Clark Kent “action” figure) and we agreed that a good first task—both straightforward and relatively modest—would be to render the starry backdrop for the game.
Now, rendering space is nothing new—heck, Elite, one of the first procedurally-generated games, had players hopping between galaxies way back in 1984. Even so, we’ve come a long way since then, although I’d argue we’ve become a bit too fond of nebulae. It’s… forgivable when these games take place in the furthest-flung fantastical corners of space. On the other hand, when it comes to our own (very real) Solar System, especially from the vantage point of the Earth, I find it inexcusable that certain triple-A studios should render space so incredibly poorly.
The sad fact is that space, statistically speaking, is boring—our own neighbourhood especially so. Sure, Hubble and the like get all the beautiful (usually false-coloured) images, but to you and me it’s all just a bunch of whitish dots and fuzzier whitish dots out there. So for the sake of realism we can nix the nebulae, although that still leaves us the task of figuring out where each individual star should go. Of course, this was an option:
for(i=0; i < NUM_STARS; ++i) {
  float vert = Random(0, 360);
  float horiz = Random(0, 360);
  float x, y, z = some boring trigonometry stuff
  stars[i] = new Star(x, y, z);
}
But if I’m known for one thing, it’s for devilish good looks and a pedantic adherence to observable scientific fact. Where’s the fun in a random star field? Where, more importantly, are the constellations2? I want people to recognise the familiar faces of the celestial sphere, to feel at home in our own stellar neighbourhood, and that requires accurate star placement. Unfortunately, scientists now agree that there are probably over two dozen stars visible from outer space, and I would be loathe to research each one individually and assign their XYZ co-ordinates by hand.
Luckily, I didn’t have to. Millions of years ago, a brilliant Greek astronomer named Hipparchos of Nicaea decided to have a satellite-based stellar mapping mission named after himself, and so he began to catalogue the stars, refining trigonometry and inventing the concept of apparent stellar magnitude along the way (no biggie). To honour his incredible dorkiness, the ESA much more recently (think 1989-1993) ran the HIgh-Precision PARallax COllecting Satellite (HIPPARCOS) mission—what was, essentially, a satellite-based stellar mapping mission named after Hipparchos. How ironic!
HIPPARCOS took detailed quantitative measurements (position, magnitude, spectrum, proper motion, variability, &c.) of individual stars, capturing high-quality data for 118,000 or so; further re-analysis gave rise to the marginally less-accurate Tycho-2 Catalogue, which actually contains data on over 2.5 million stars.
Now, for my purposes, the original 118,000 HIPPARCOS observations are more than enough (in any case, most of the Tycho-2 stars are beyond what’s visible to the human eye). But here’s the best part: all that data—every last, delicious drop of it—is available online. For free. Visit that link, hit the “VizieR” tab next to the ReadMe, choose the HIPPARCOS main catalogue, define your data of interest, and download it. For free.
Data. Science. Space. Amazing. Science again.
I’ll leave the discussion on the merits of open data for another blog post (or just to smarter people than myself); for now, let’s focus on what HIPPARCOS can do for Red Rover.
Oh, but first, a small digression. I should at this point mention that, for this project, I’m working with Unity. I felt a bit of less-shame turning my back on the truly cross-platform OGRE library, with which I’d originally started work on Red Rover—but at this point I’d like to release the game as soon as possible. My Spare Parts experience is still a rather vivid reminder of the perils of low-level engine tweaking, and I thought it best to avoid a repeat by switching to something a bit more streamlined and fully-featured. But much like Luke to Yoda, I shall return… I’m reasonably confident of the fact. So, onward we must go… with Unity!
And now, back to HIPPARCOS. Again, my needs for Red Rover are rather simple. Star position is of course the most important datum, and is available in degrees of right ascension and declination. If I define the +Z axis as being the direction of the first point of Aries, all I have to do is define a frame of reference rotated 23.44° around that axis to simulate the Earth’s axial tilt in Unity’s co-ordinate space3. Right ascension and declination then become trivial quaternion rotations within that newly-tilted frame. Next, I simply define a static, one-shot Unity particle system with the appropriate number of particles, and cycle through the HIPPARCOS stars line by line to place each individual particle at the appropriate XYZ co-ordinates.

All stars are equal. Some are more equal than others.
This is… well, technically interesting I suppose—but as some of you may have noticed, it leaves us with a celestial sphere filled with identical white dots, when in fact most stars are well-known for being exactly the opposite of identical. In reality, every star can be assigned a stellar class based on its spectral characteristics, effectively defining their colour and intensity.
As it so happens, colour is recorded in HIPPARCOS using the Johnson UBV photometric system. Three filters are applied separately to a star—ultraviolet (U), blue (B), and visible (V)—and the associated magnitudes recorded; the differences in magnitude describe the colour of the star. The shorthand used in HIPPARCOS is (B-V): magnitude in the blue filter minus magnitude in the visible (redder) filter. Keeping in mind that the brighter a star appears, the lower its magnitude is numerically, we might imagine a star with the following characteristics:
mag(B) = 1
mag(V) = 1.5
(B-V) = -0.5
Since this star is brighter qualitatively (smaller numerically) in the blue filter, we deduce that it will appear blueish. From this we can infer that the more negative a star’s (B-V) value, the bluer it will be; and conversely, the more positive the value, the more the star is shifted towards the red end of the spectrum4. And with that, we can spruce up the stars in Red Rover by simply tweaking each particle’s RGB values (within certain min. and max. limits) based on their HIPPARCOS (B-V) measurements.
Finally, HIPPARCOS also contains data on apparent magnitudes, which is basically a function of a star’s absolute intensity combined with its distance from the Earth. Once again, the brighter an object, the lower its apparent magnitude: for example, the Sun is around -26 in apparent magnitude; the Moon is -13; Venus is -4; and Sirius, the brightest star in the sky, is around -1.445. Using this system, and applying certain lower and upper bounds, we can change the size of a particle based on the apparent magnitude recorded by HIPPARCOS for the corresponding star. To further make the brightest stars (the ones we usually associate with constellations) “pop,” I apply a sigmoid function to all particles’ alpha values. In essence, the dimmer a star, the more it becomes transparent when rendered (to a given lower limit); the brighter it is, the more it is pushed towards fully opaque and bright.
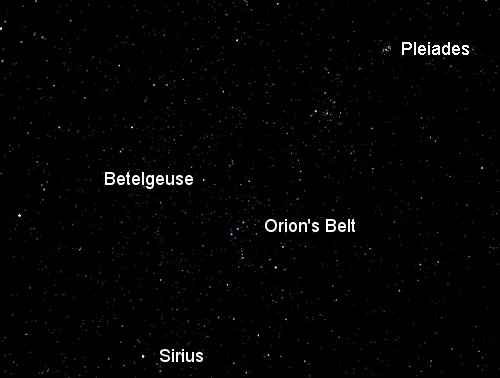
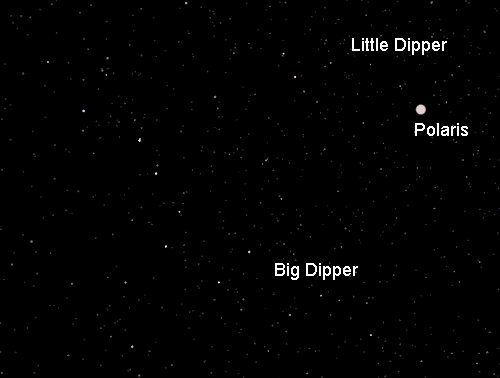
Whew, look at me go on like that! Now, this has been a fairly complex and long-winded discussion about how to place and manipulate our particles in order to simulate the celestial sphere. But, frankly, I like to think the results speak for themselves.

Orion, my favourite 8-minute Metallica instrumental.

The Dippers, with Polaris comically oversized to provide a reference point.
To quote one of my favourite professors: and there you have it! While it may look underwhelming at these resolutions, the fundamentals are there. Here we have some of the most famous modern constellations laid out exactly as they should be. Here’s what really gets me, though: all of this was automated through the data. At no point did I have to place a star individually; I just wrote a few lines of code, and 100,000 or so stars were delicately hung from the heavens so as to create the stellar patterns we know and friends-with-benefits. I know mine isn’t the first application to do so—but dammit, it’s mine. And I think it’s radical.
Now, some of you out there might accuse me of being rather narrow-minded and Northern hemisphere-centric in my examples above. True enough! And what of all the other stars and constellations—shouldn’t they get their day in the Sun? Absolutely, and an excellent pun to boot! But I say, what’s this! I built this test in Unity, and here you are using a web browser…
Wanna see it?
Indeed, this very basic test of mine is now online. A few things you should know first:
- WASD to move around, mouse to look. These controls won’t be present in the actual game, but for now they allow one to evaluate the scene. And the mouse-look is vertically inverted, because that’s how I like it and all of you can just go and cry if you don’t.
- There is a small square plane just in front of you when you begin; this is merely provided for spatial reference.
- The star data takes a while to load. It’s only a 4MB file, but as it’s downloading, you’ll see a swarm of particles in front of you until the HIPPARCOS data is ready and they’re all moved into position.
- Looking straight ahead at the beginning, look to your left and about 10° down to find Orion. I leave the rest of the starspotting up to you.
In conclusion, esteemed colleagues: thank you kindly for indulging me in this rather long-winded post.
Now click here to visit the stars.
-
For what it’s worth, I did finally settle on the Orx engine, which seems to gracefully combine purely config file-based prototyping with a more traditional and well-designed API. It suits me. ↩
-
Oh, I suppose you could subjectively impose your own cultural memes onto a randomly distributed collection of dots. But really, who does that anymore? ↩
-
Keep in mind that Unity’s co-ordinate system is left-handed, with +Z passing “into” the screen. Naturally, after having spent six months in OpenGL, this was a constant source of strange and hilarious bugs for me. ↩
-
This is NOT to be confused with Doppler red- and blue-shifts, which I have not taken into account in my calculations. ↩
-
This system, as mentioned above, is generally attributed to Hipparchos, although his scale simply ran from mag=1 (bright) to mag=6 (the faintest stars visible to the unaided human eye). The scale was standardised and made rigourous only in much more recent years, yielding a huge increase in accuracy, as well as being applied to other celestial bodies such as the Sun and Moon. ↩